
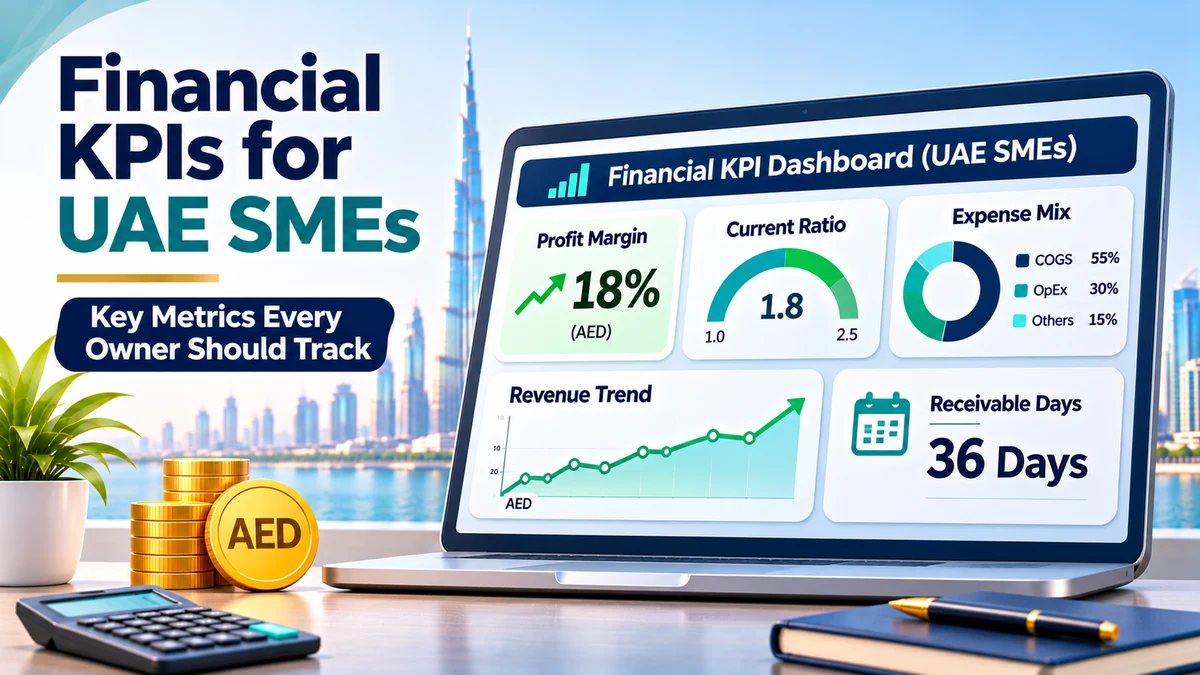
Financial KPIs for small business owners are the key numbers that show whether a company is profitable, liquid, efficient and financially healthy. Instead of reading pages of financial statements, a well-chosen set of KPIs gives UAE business owners a quick, reliable view of performance and early warning when something is going wrong.
Whether you run a trading company in Dubai, a services firm in Abu Dhabi or an e-commerce brand in a free zone, tracking the right SME financial metrics helps you make faster, better decisions. This guide explains the most important financial performance indicators, how to calculate them, what they mean, and how often to review them, with a full worked example in AED.
What Are Financial KPIs?
Financial key performance indicators (KPIs) are measurable values, usually ratios or percentages, calculated from your profit and loss statement, balance sheet and cash records. Many of them are also known as business financial ratios.
Financial KPIs generally fall into four groups:
- Profitability KPIs: how much profit the business generates from its sales and assets.
- Liquidity KPIs: whether the business can meet its short-term obligations.
- Efficiency KPIs: how well the business manages receivables, inventory and payables.
- Leverage and growth KPIs: how the business is financed and how fast it is growing.
Why Are Financial KPIs Important?
Tracking financial KPIs for small business operations helps owners to:
- Measure business health objectively rather than relying on bank balance or gut feeling
- Spot trends early, such as shrinking margins or slower customer payments
- Compare performance over time, against budget and against industry norms
- Set clear targets for managers and teams
- Support finance applications, as banks review many of these ratios when assessing credit
- Prepare for growth or investment, since investors expect clear financial metrics
Illustrative Business Figures Used in This Guide
To make each KPI practical, we will use the following illustrative annual figures for a UAE trading SME:
| Profit and Loss Item | AED | Balance Sheet Item | AED |
|---|---|---|---|
| Revenue | 2,400,000 | Cash | 150,000 |
| Cost of goods sold | 1,560,000 | Accounts receivable | 330,000 |
| Gross profit | 840,000 | Inventory | 240,000 |
| Operating expenses | 600,000 | Total current assets | 720,000 |
| Operating profit | 240,000 | Total assets | 1,100,000 |
| Finance costs | 20,000 | Accounts payable | 260,000 |
| Net profit | 220,000 | Total current liabilities | 400,000 |
| Prior year revenue | 2,100,000 | Long-term loan | 100,000 |
| Total equity | 600,000 |
Financial KPI Comparison Table
| KPI | Formula | What It Shows | Example Result |
|---|---|---|---|
| Gross profit margin | Gross Profit ÷ Revenue × 100 | Profit earned on products or services before overheads | 35.0% |
| Operating profit margin | Operating Profit ÷ Revenue × 100 | Profitability of core operations | 10.0% |
| Net profit margin | Net Profit ÷ Revenue × 100 | Overall profit retained from each dirham of sales | 9.2% |
| Current ratio | Current Assets ÷ Current Liabilities | Ability to meet short-term obligations | 1.80 |
| Quick ratio | (Current Assets – Inventory) ÷ Current Liabilities | Liquidity without relying on stock | 1.20 |
| Return on assets | Net Profit ÷ Total Assets × 100 | How efficiently assets generate profit | 20.0% |
| Accounts receivable days | Accounts Receivable ÷ Revenue × 365 | Average days customers take to pay | 50 days |
| Inventory days | Inventory ÷ COGS × 365 | Average days stock is held before sale | 56 days |
| Accounts payable days | Accounts Payable ÷ COGS × 365 | Average days taken to pay suppliers | 61 days |
| Debt-to-equity ratio | Total Liabilities ÷ Total Equity | Reliance on borrowed funds versus owner funds | 0.83 |
| Revenue growth rate | (Current Revenue – Prior Revenue) ÷ Prior Revenue × 100 | Speed of business growth | 14.3% |
Now let us look at the most important KPIs in more detail.
What Is Gross Profit Margin?
Gross profit margin shows what percentage of revenue remains after deducting the direct cost of the goods or services sold.
Gross Profit Margin = Gross Profit ÷ Revenue × 100
Example: 840,000 ÷ 2,400,000 × 100 = 35.0%
This means that for every AED 100 of sales, the business keeps AED 35 to cover overheads and profit. A falling gross margin often signals rising supplier costs, heavy discounting, a shift towards lower-margin products or inventory valuation issues. For trading businesses, this is usually the most important KPI to watch.
How Is Net Profit Margin Calculated?
Net profit margin measures how much of each dirham of revenue becomes final profit after all expenses, finance costs and tax where applicable.
Net Profit Margin = Net Profit ÷ Revenue × 100
Example: 220,000 ÷ 2,400,000 × 100 = 9.2%
If gross margin is healthy but net margin is low, overheads such as salaries, rent, marketing or finance costs may be too high. Comparing gross and net margins side by side quickly shows where profit is being lost.
What Is the Current Ratio?
The current ratio measures whether a business has enough short-term assets to cover its short-term liabilities.
Current Ratio = Current Assets ÷ Current Liabilities
Example: 720,000 ÷ 400,000 = 1.80
The business has AED 1.80 of current assets for every AED 1 of current liabilities. Many SMEs aim for a ratio between roughly 1.2 and 2.0, though the right level depends on the industry. For a deeper look at managing this ratio, see our guide on working capital management for UAE SMEs.
What Is the Quick Ratio?
The quick ratio (or acid-test ratio) is a stricter liquidity measure that excludes inventory, because stock cannot always be converted to cash quickly.
Quick Ratio = (Current Assets – Inventory) ÷ Current Liabilities
Example: (720,000 – 240,000) ÷ 400,000 = 1.20
A quick ratio above 1.0 suggests the business could meet its short-term obligations without selling stock. A large gap between the current ratio and quick ratio shows heavy reliance on inventory.
How Do You Measure Return on Assets?
Return on assets (ROA) shows how effectively the business uses its total assets, including cash, receivables, stock, equipment and vehicles, to generate profit.
Return on Assets = Net Profit ÷ Total Assets × 100
Example: 220,000 ÷ 1,100,000 × 100 = 20.0%
An ROA of 20% means each AED 100 of assets generated AED 20 of profit during the year. A declining ROA can indicate idle assets, excess stock, slow-paying customers or falling profitability. Some businesses use average total assets for a more accurate calculation.
What Are Accounts Receivable Days?
Accounts receivable days (also called Days Sales Outstanding or DSO) measure how long, on average, customers take to pay their invoices.
Accounts Receivable Days = Accounts Receivable ÷ Revenue × 365
Example: 330,000 ÷ 2,400,000 × 365 = approximately 50 days
If your standard credit terms are 30 days but receivable days are 50, customers are paying significantly late, tying up cash. In the UAE, where long B2B payment cycles are common, this KPI deserves close monthly attention. Reducing receivable days by even 10 days in this example would release around AED 65,800 in cash (2,400,000 ÷ 365 × 10).
Other Useful Financial KPIs for UAE SMEs
Operating Profit Margin
Operating Profit ÷ Revenue × 100. In our example, 10.0%. This shows the profitability of core operations before finance costs and tax.
Inventory Days and Inventory Turnover
Inventory days = 240,000 ÷ 1,560,000 × 365 ≈ 56 days. Inventory turnover = COGS ÷ Inventory = 1,560,000 ÷ 240,000 = 6.5 times per year. Rising inventory days can signal slow-moving or excess stock.
Accounts Payable Days
Accounts payable days = 260,000 ÷ 1,560,000 × 365 ≈ 61 days. This shows how long the business takes to pay suppliers. Paying too slowly can damage supplier relationships, while paying too quickly can strain cash.
Debt-to-Equity Ratio
Total liabilities (400,000 + 100,000 = 500,000) ÷ Equity 600,000 = 0.83. A higher ratio means greater reliance on borrowing and higher financial risk.
Revenue Growth Rate
(2,400,000 – 2,100,000) ÷ 2,100,000 × 100 = 14.3%. Growth should be monitored alongside margins and cash, as fast growth with falling margins or rising receivable days can create cash pressure.
Which Financial KPIs Are Important for Trading Businesses?
Trading companies, which make up a large share of UAE SMEs, should give particular priority to:
- Gross profit margin: the core measure of buying and selling performance
- Inventory days and inventory turnover: how quickly stock converts to sales
- Accounts receivable days: especially for B2B distributors offering credit
- Accounts payable days: balancing supplier relationships and cash
- Quick ratio: liquidity without relying on stock
- Net profit margin: overall profitability after overheads
Service businesses, by contrast, may focus more on utilisation, revenue per employee, receivable days and net profit margin, as they typically hold little inventory.
How Frequently Should Financial KPIs Be Reviewed?
| Frequency | KPIs to Review |
|---|---|
| Weekly | Cash balance, sales, overdue receivables |
| Monthly | Gross and net profit margin, current and quick ratio, receivable, inventory and payable days, budget vs actual |
| Quarterly | Return on assets, debt-to-equity, revenue growth, trends against previous quarters |
| Annually | Full ratio analysis, benchmarking and target setting for the next year |
KPIs are most useful when tracked as trends over time and compared with your budget. Our guide on budget vs actual analysis explains how to combine KPIs with monthly variance reporting.
How Can a Business Measure Financial Health?
No single KPI tells the full story. A business is generally in good financial health when it shows:
- Stable or improving gross and net profit margins
- A current ratio and quick ratio comfortably above 1.0
- Receivable days close to agreed credit terms
- Controlled inventory levels with healthy turnover
- A manageable debt-to-equity ratio
- Positive revenue growth without deteriorating cash position
Building a simple KPI dashboard with these indicators gives business owners a clear one-page view of performance each month.
Common Mistakes When Using Financial KPIs
- Tracking too many KPIs: focus on 8 to 12 that genuinely drive decisions.
- Using inaccurate data: KPIs are only reliable if bookkeeping and reconciliations are up to date.
- Looking at one month in isolation: trends matter more than single results.
- Ignoring industry context: a good margin for a trading company differs from a consultancy.
- Not linking KPIs to action: every adverse trend should trigger a clear response.
- Inconsistent calculations: use the same formulas every period for comparability.
Frequently Asked Questions
Which financial KPIs should small business owners monitor?
Most small business owners should track gross profit margin, net profit margin, current ratio, quick ratio, accounts receivable days, inventory days (if holding stock), return on assets and revenue growth.
What are the most important financial ratios for SMEs?
Profitability ratios (gross and net margin), liquidity ratios (current and quick ratio) and efficiency ratios (receivable and inventory days) are generally the most important business financial ratios for SMEs.
How do you measure business profitability?
Business profitability is usually measured using gross profit margin, operating profit margin, net profit margin and return on assets, which together show profit at each level of the business.
Which financial metrics should business owners review monthly?
Monthly reviews should cover revenue, gross and net profit margins, cash position, current and quick ratios, receivable days, inventory days and budget vs actual variances.
Can accounting software calculate financial KPIs automatically?
Many accounting platforms provide dashboards and ratio reports, and others allow you to export data into spreadsheets or reporting tools. Accuracy depends on how well transactions are recorded and categorised.
Conclusion
Tracking the right financial KPIs for small business success gives UAE SME owners a clear, objective view of profitability, liquidity and efficiency. By monitoring a focused set of financial performance indicators, such as gross profit margin, net profit margin, current ratio, quick ratio, return on assets and accounts receivable days, business owners can spot issues early and make better, data-driven decisions.
Accurate KPIs start with accurate books. If you need help producing reliable financial statements, monthly KPI dashboards or management reports, 360Bizs can support you. Explore our accounting and bookkeeping services or contact our team today.